Monitoring
with Prometheus, Alert Manager & Grafana

KSS Con'19
Adam Płaczek
Why do we need monitoring ?
-
Want to know when things go wrong before buisness does
-
Investingate the system when something does go wrong
-
Analyze long term trends
-
Alarm on call person
- Compare performance of different software versions
- Post mortem analysis
- Overal system health dashboards
What needs monitoring ?
| INFRASTRUCTURE static |
SERVICES dynamic |
|---|---|
| Servers | Containers |
| Network | Virtual machines |
| Storage | PaaS |
| Datacenter | Microservices |
Tools


Oldschool
Newschool


Prometheus
Created at SoundCloud at 2012 by ex-Google engineers. Based on Google BorgMon.
Joined the Cloud Native Computing Foundation in 2016 as the second hosted project, after Kubernetes.
Comes with builtin time series database TSDB
Time series collection happens via a PULL model over HTTP. However PUSH model is still possible with Push Gateway
Targets are discovered via service discovery or static configuration
No HA- single server is independent. It is possible to stack multiple servers into Federation
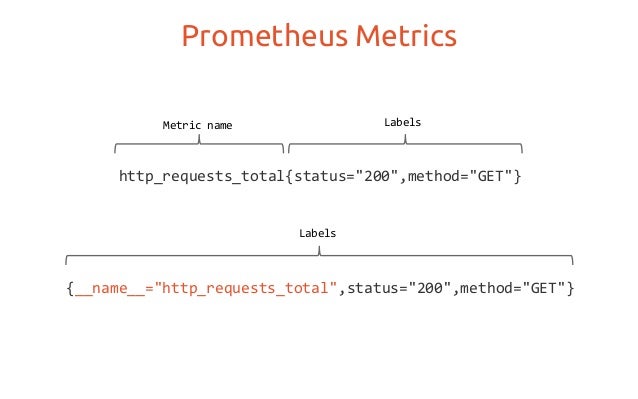
Time series & metrics
Every time series is uniquely identified by its metric name and a set of key-value pairs, also known as labels.
Monitored systems expose metrics over HTTP /metrics endpoint.
Prometheus stores metrics in its time-series database and makes them available via PromQL query language
/metrics
Getting data into Prometheus
Go Java Scala Python Ruby Node.js Perl PHP Rust
When Prometheus scrapes your instance's HTTP endpoint, the client library sends the current state of all tracked metrics to the server
node_exporter Blackbox AWS cloudwatch statsD SNMP
Useful for cases where target system does not expose HTTP endpoint natively- for example Linux system stats
Intermediary service which allows you to push metrics from jobs which cannot be scraped
What are the key KPIs ?
The RED Method - microservices
- Rate (R): The number of requests per second.
- Errors (E): The number of failed requests.
- Duration (D): The amount of time to process a request.
The USE Method - hardware
- Utilization (U): The percentage of time a resource is in use.
- Saturation (S): The amount of work the resource must (the “queue” of work).
- Errors (E): A count of errors.
PromQL
Get all time series with the metric http_requests_total
http_requests_total
Get number of requests to URI /api/comments
http_requests_total{ handler="/api/comments"}
Get the per-second rate for all requests, the last 5 minutes:
rate(http_requests_total[5m])
Sum over the rate of all instances, group by requested URI
sum(rate(http_requests_total[5m])) by (uri)
Alert Manager
Handles alarms received from Prometheus.
Alertmanager manages alerts, including silencing, inhibition, aggregation and sending out notifications via email, Slack, Symphony and many more channels. Example alarm rule:
groups:
- name: example
  rules:
 - alert: APIHighRequestLatency
    expr: api_http_request_latencies_second{quantile="0.5"} > 1
    for: 10m
    annotations:
      summary: "High request latency on {{ $labels.instance }}"
      description: "{{ $labels.instance }} has a median request latency above 1s (current value: {{ $value }}s)"
Grafana
Grafana is feature rich platform for metrics visualisation, dashboard creation and alerting.
Retrieves data from Prometheus database
Monitoring stack architecture

Prometheus federation
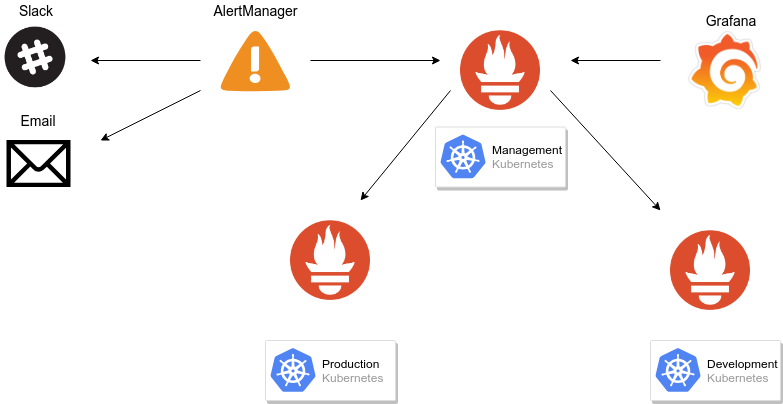
Federation allows a Prometheus server to scrape selected time series from another Prometheus server.
Demo
Deploy locally Prometheus, Alert Manager and Grafana.
https://github.com/PagerTree/prometheus-grafana-alertmanager-example

Deploy Dragon Ball mapper to GKE Kubernetes

Add Dragon Ball Mapper to Prometheus targets

Create  graph in Grafana

Create EC2 Instance in AWS

Expose system metrics with node exporter

Add instance to Prometheus targets

Send Alarm to Slack Channel